

Web performance
Chrome DevTools December 2026: 26% Faster Trace Parsing, Lantern HTTP/3 Multiplexing, and V8 Heap Contexts
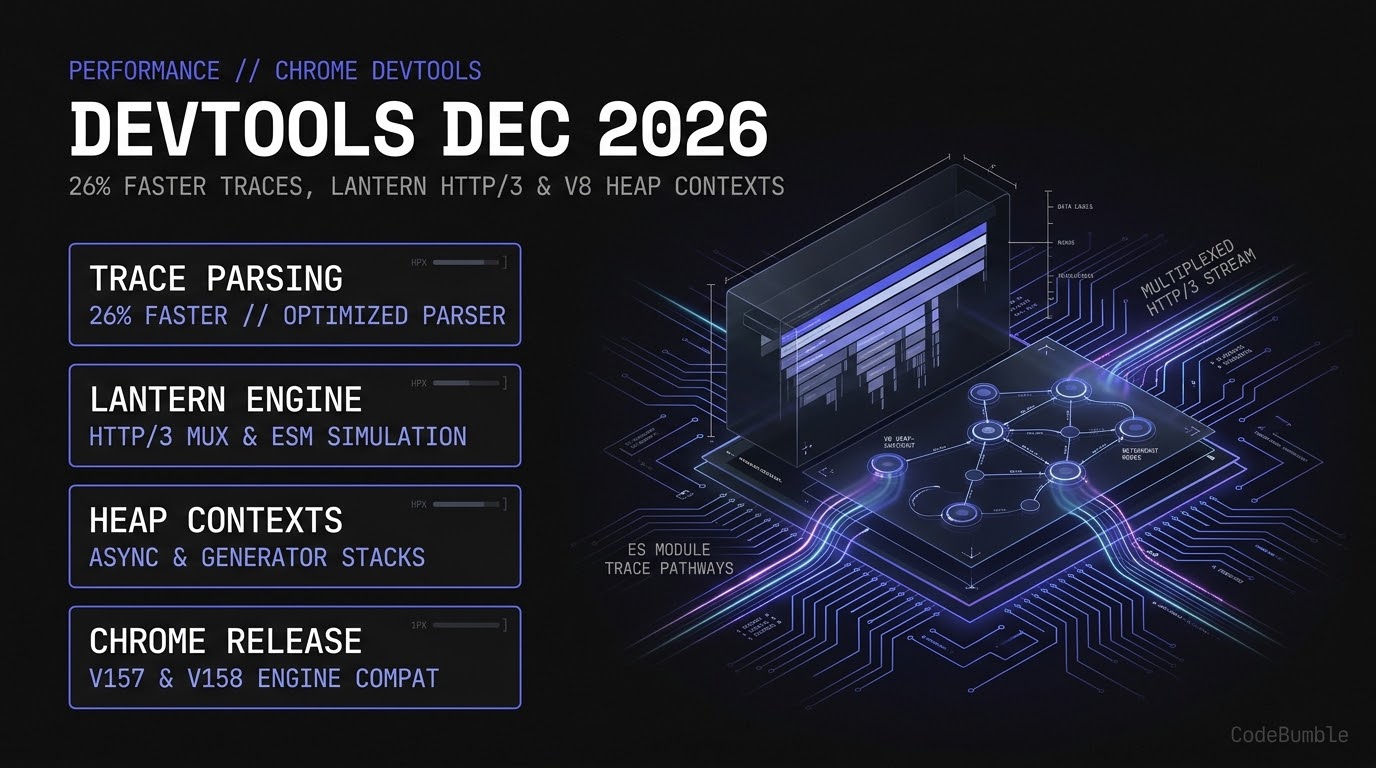
Chrome DevTools December 2026 (Chrome 157 and 158) cuts large trace parsing time by roughly 26%, adds HTTP/3 multiplexing and ES module simulation to Lantern, refines V8 async/generator heap context analysis, and expands offline heap diffing in chrome-devtools-mcp.
11 min read
Chrome DevTools December 2026: 26% Faster Trace Parsing, Lantern HTTP/3 Multiplexing, and V8 Heap Contexts
Executive Summary
On November 13, 2026, the Chrome DevTools team published the December 2026 DevTools release notes, detailing performance, memory, and agentic debugging updates landing across Chrome 157 and Chrome 158 (with Chrome 158 entering early stable on Android on November 12, 2026 after its October 28 beta). For web performance engineers, the release targets three chronic bottlenecks in lab diagnostics and memory profiling: slow trace ingestion on large single-page applications, inaccurate network simulation for multiplexed HTTP/3 and ES module graphs, and false-positive "dead context" noise in V8 heap snapshots caused by suspended async functions and generators.
Specifically, the updated trace engine cuts parsing time on large traces by roughly 26% while lowering peak memory consumption, optimizes flame chart canvas redraws, and deduplicates script sizes in Treemap. Inside the Lantern simulation engine—which also powers Lighthouse 13.6.0 on PageSpeed Insights—Chrome now treats HTTP/3 connections as multiplexed in ConnectionPool, resets HTTP/2 overflow bytes across sequential requests, and models ES module compilation and evaluation trace events. Meanwhile, the Chrome DevTools MCP server (chrome-devtools-mcp) gains offline .heapsnapshot context analysis, parallel multi-page tool execution, and uncached trace recording via ignoreCache.
Confidence level: High for all DevTools, Chrome 158, and Lighthouse 13.6.0 features, which are verified against primary Chrome for Developers release notes and Chromium blog posts. Independent benchmark figures for Lantern 13.6.0 score shifts come from third-party CLI tests on react.dev and Framer sites rather than a Google-wide dataset; Google has not published a standalone cross-origin benchmark for the 26% trace-engine speedup beyond the "roughly 26% on large traces" figure in the official release notes.
Technical Mechanics and Architecture
Trace Engine Optimization and Treemap Deduplication
Profiling complex applications—especially React, Vue, or WebAssembly workloads with multi-second main-thread activity—often stalls inside DevTools itself before an engineer can inspect a single frame. In the December 2026 update, the Chrome DevTools Performance panel reduces both CPU parsing latency and peak RAM footprint during trace ingestion. According to the Chrome for Developers announcement, a series of trace engine optimizations improves parsing speed by roughly 26% on large traces while reducing peak memory usage.
Alongside parser throughput, two UI-layer changes directly affect how engineers read large bundles:
- Flame chart canvas redraw optimizations: Zooming and panning across dense call stacks trigger fewer redundant canvas repaints, keeping 60 fps scrubbing responsive on multi-hundred-megabyte traces.
- Deduplicated script sizes in Treemap: Previously, shared or repeatedly referenced script entries could inflate apparent bundle weight in the Treemap view. Deduplication ensures that byte totals reflect unique script payloads rather than double-counting shared module references.
Lantern HTTP/2, HTTP/3, and ES Module Simulation
By default, Lighthouse and DevTools Insights simulate mobile throttling using Lantern, a predictive network-and-CPU dependency graph simulator that records a trace at full speed and then models how those requests and tasks would execute on a constrained device and network. Earlier versions of Lantern introduced systematic pessimism on modern transport stacks and module-heavy applications.
+-----------------------------------------------------------------------+
|                    LANTERN SIMULATION PIPELINE                        |
+-----------------------------------------------------------------------+
|                                                                       |
|  [Raw Trace Events]                                                   |
|   |-- Network Requests (protocol: h2 / h3, renderBlocking status)     |
|   |-- ES Module Events (Compile / Evaluate)                           |
|   v                                                                   |
|  [ConnectionPool Model]                                               |
|   |-- HTTP/2: Reset overflow bytes across sequential requests         |
|   |-- HTTP/3: Treat QUIC connections as multiplexed (non-blocking)    |
|   v                                                                   |
|  [Critical Path & Metric Estimator]                                   |
|   |-- Uses protocol renderBlocking status (fallback: fetch priority)  |
|   |-- Aligns same-frame text LCP task set with FCP                    |
|   |-- Accounts for ES module compile + evaluate dependency edges      |
|                                                                       |
+-----------------------------------------------------------------------+
In the December 2026 DevTools update—mirroring the Lighthouse 13.6.0 Lantern rework—three transport and execution modeling fixes take effect:
- HTTP/3 multiplexing in
ConnectionPool: Lantern now treats HTTP/3 (QUIC) connections as multiplexed rather than serializing concurrent stream requests behind single-connection head-of-line assumptions. - HTTP/2 overflow byte resets: Across sequential requests on HTTP/2 connections, Lantern resets overflow bytes so leftover credit from one transfer does not distort downstream request timing.
- ES module compilation and evaluation events: Applications shipping native
<script type="module">graphs generate distinct module compilation and evaluation trace events. Lantern now incorporates these events into its dependency graph, improving simulated timing accuracy for ESM-heavy frontends.
V8 Heap Snapshot Contexts for Async Functions, Generators, and ESM
Memory leak triage in modern JavaScript frequently suffers from misleading "dead context" reports. When a V8 Context is shared or retained by closures, DevTools attempts to surface unreferenced context variables. However, prior heuristics misclassified suspended control-flow structures and completed module wrappers.
The Memory panel now applies four targeted refinements (Chrome for Developers):
- Suspended generators and async functions: Treated explicitly as live closures rather than dead context fields, preventing false-positive leak flags while an
awaitoryieldis pending. - Finished ES modules: Top-level functions belonging to completed ES modules are ignored during dead-context field analysis, cutting noise from one-time module initialization.
- Uncompiled functions:
ScopeInfosfor uncompiled functions are attributed to their parent scripts, giving engineers an actionable source file instead of an anonymous internal node. - Scoped live heap timeline statistics: Live heap timeline metrics are now strictly scoped to the active recording view, preventing out-of-window allocations from skewing the selected range.
In addition, the Sources panel now implements the ECMA-426 source map scopes proposal, restoring original authored variable and function names inside the Scope view, stack traces, and console expression evaluation during debugging.
Agentic Performance Workflows via chrome-devtools-mcp
Performance regression testing is increasingly automated inside merge-request pipelines. On November 10, 2026, Chrome for Developers published a case study showing how WeTV cut performance debugging time by 87% by pairing chrome-devtools-mcp with Modern Web Guidance in its CI/CD merge request flow.
The December 2026 DevTools update expands chrome-devtools-mcp with capabilities tailored for headless CI and offline post-mortem analysis:
- Offline
.heapsnapshotanalysis: Agents can parse.heapsnapshotfiles without an active browser session, callanalyze_heapsnapshot_contextsto inspect memory retained by V8 execution contexts, and paginatecompare_heapsnapshotsdiffs sorted by self-size. - Uncached trace recording: Passing
ignoreCache: truetoperformance_start_traceforces cold-cache network waterfalls during automated trace capture. - Inline Lighthouse DOM attribution:
lighthouse_auditreturns failing audits and affected DOM nodes inline, eliminating extra round-trips. - Parallel multi-page execution: Independent tool calls and page-level tools can execute in parallel across separate pages.
Below is a safe, defensive Node.js script pattern demonstrating how to configure an automated cold-cache performance trace and offline heap-diff check against a local staging build using Playwright or Puppeteer alongside Chrome DevTools Protocol (CDP) without any invasive hooks:
// Safe, defensive CDP trace & heap snapshot capture for staging verification
import { chromium } from 'playwright';
import fs from 'node:fs/promises';

async function captureColdTraceAndHeap(targetUrl, outDir = './perf-artifacts') {
  await fs.mkdir(outDir, { recursive: true });
  const browser = await chromium.launch({ headless: true });
  const context = await browser.newContext({ bypassCSP: false });
  const page = await context.newPage();
  const cdp = await context.newCDPSession(page);

  // Ensure cold cache for realistic first-load Lantern / waterfall baseline
  await cdp.send('Network.enable');
  await cdp.send('Network.setCacheDisabled', { cacheDisabled: true });

  await cdp.send('Tracing.start', {
    categories: 'devtools.timeline,v8.execute,blink.user_timing,netlog',
    transferMode: 'ReturnAsStream',
  });

  await page.goto(targetUrl, { waitUntil: 'networkidle' });

  // Capture V8 heap snapshot for offline analyze_heapsnapshot_contexts inspection
  let snapshotChunks = [];
  cdp.on('HeapProfiler.addHeapSnapshotChunk', ({ chunk }) => {
    snapshotChunks.push(chunk);
  });
  await cdp.send('HeapProfiler.enable');
  await cdp.send('HeapProfiler.takeHeapSnapshot', { reportProgress: false });
  await fs.writeFile(`${outDir}/staging.heapsnapshot`, snapshotChunks.join(''), 'utf8');

  const tracePromise = new Promise((resolve) => {
    cdp.once('Tracing.tracingComplete', async ({ stream }) => {
      let traceData = '';
      let eof = false;
      while (!eof) {
        const res = await cdp.send('IO.read', { handle: stream });
        traceData += res.data;
        eof = res.eof;
      }
      await cdp.send('IO.close', { handle: stream });
      resolve(traceData);
    });
  });

  await cdp.send('Tracing.end');
  const traceJson = await tracePromise;
  await fs.writeFile(`${outDir}/cold-trace.json`, traceJson, 'utf8');

  await browser.close();
}
Evidence and Real-World Impact
To separate tool-side simulation shifts from genuine production speedups, engineers must distinguish lab data (Lighthouse / Lantern) from field data (Chrome UX Report, or CrUX).
| Metric / Capability | Previous Behavior | December 2026 / Lighthouse 13.6 Behavior | Impact on Engineering Teams |
|---|---|---|---|
| Large Trace Parsing | Baseline DevTools trace engine | ~26% faster parsing; lower peak RAM | Shorter wait times on multi-second SPA traces |
| Treemap Script Sizes | Potential duplicate counting | Deduplicated script sizes | Accurate bundle attribution in Performance panel |
| HTTP/3 in Lantern | Non-multiplexed / legacy pooling | Treated as multiplexed in ConnectionPool |
Eliminates artificial HTTP/3 waterfall queuing in lab |
| HTTP/2 Overflow Bytes | Carried across sequential requests | Reset across sequential requests | Prevents cumulative byte-credit drift in simulation |
| Async / Generator Heap | Flagged as dead context fields | Recognized as live closures | Fewer false-positive memory leak investigations |
| CrUX 28-Day Field Data | Real Chrome user telemetry (p75) | Unchanged by Lantern updates | Remains the ground truth for Core Web Vitals & SEO |
Independent tests of the underlying Lighthouse 13.6.0 Lantern update (which shares the HTTP/3 multiplexing and H2 overflow fixes before shipping in Chrome 159 DevTools on December 8, 2026) illustrate how sensitive lab scores are to the simulator:
- JavaScript-heavy SPA (
react.dev): In three-run CLI comparisons on the same machine between Lighthouse 13.5.0 and 13.6.0, mobile median performance jumped from 65 to 94, simulated LCP fell from 7.3 s to 1.3 s, and Total Blocking Time (TBT) dropped from 270 ms to 140 ms (desktop moved from 99 to 100). - Framer sites cohort: In tests published November 3, 2026 by Ivan Akulov and Jurre Houtkamp, the median mobile score change across top Framer sites was +1.5 points, with outliers such as
legora.commoving from 36 to 61 andtwingate.commoving from 34 to 58. However, Framer also noted an important caveat: when the LCP element is an image, Lantern can still count nearly every request that finished before the image. - Static low-JS site (
nemociment.fr): On a lightweight static site, the median mobile score actually moved down from 79 to 72 (desktop remained 96), confirming that Lantern calibration changes can raise or lower lab scores depending on asset composition.
Meanwhile, in DevTools' Network panel, WebSocket debugging also gained precision: the Messages tab now computes accurate UTF-8 byte lengths for non-ASCII text frames, and network search checks locally cached response bodies before querying the backend.
Hardening and Optimization Playbook
Use this six-step playbook to adopt the December 2026 DevTools performance and memory improvements without misreading lab score shifts.
1. Audit Trace Version Parity Before Reporting Regressions
Never compare a Lighthouse or DevTools performance score captured before a simulator update against one captured afterward. Always record the exact Chrome milestone (157, 158, or 159) and Lighthouse version (13.5.0 vs. 13.6.0) in CI logs and executive dashboards.
2. Enable Cold-Cache Automated Traces in CI
When running chrome-devtools-mcp in merge-request pipelines, explicitly pass ignoreCache: true to performance_start_trace. Warm-cache traces mask HTTP/2 and HTTP/3 connection setup costs and hide missing Cache-Control or 103 Early Hints regressions.
3. Re-Verify HTTP/3 and CDN Multiplexing Headers
Because Lantern now models HTTP/3 connections as multiplexed in ConnectionPool, verify that your CDN and reverse proxy (such as Nginx or Cloudflare) advertise Alt-Svc: h3=":443"; ma=86400 and do not downgrade to HTTP/1.1 on origin-to-edge hops.
# Safe read-only check for HTTP/3 Alt-Svc advertisement and TLS handshake
curl -sI --http3-only https://your-staging-domain.example/ | grep -iE 'HTTP/|alt-svc|cache-control'
4. Triage V8 Memory Leaks Using analyze_heapsnapshot_contexts
Export .heapsnapshot artifacts from long-running Playwright or Puppeteer end-to-end flows and inspect them offline with analyze_heapsnapshot_contexts or the Chrome 158 Memory panel. Focus on retained DOM nodes and ScopeInfos attributed to parent scripts—now that suspended async closures and finished ES modules are filtered out, remaining retained contexts are far more likely to represent genuine leaks.
5. Use :buffering and :stalled States to Harden Media UX
In the Elements panel's :hov pane, force :buffering and :stalled on <video> and <audio> elements to verify that loading skeletons and fallback indicators render without triggering Cumulative Layout Shift (CLS) on throttled connections.
6. Rollback and Baseline Isolation Note
If a staging trace or heap audit triggers a false regression alert after upgrading Chrome or chrome-devtools-mcp, do not immediately revert application code. Re-run the baseline commit on the same Chrome/Lighthouse version to isolate simulator drift from code changes, and pin your CI container image digest (chrome-for-testing + chrome-devtools-mcp version) so every PR compares against an identical engine build.
Frequently Asked Questions (FAQ)
1. Does the 26% trace parsing speedup apply to all DevTools traces?
The Chrome for Developers release notes specify that the trace engine optimizations improve parsing speed by roughly 26% on large traces while reducing peak memory usage. Smaller traces already parse quickly, so the largest wall-clock savings appear on multi-second SPA recordings with heavy main-thread activity.
2. Why did my PageSpeed Insights score change if my site didn't change?
PageSpeed Insights updated to Lighthouse 13.6.0 on November 2, 2026 (Minerva Web Development). Its updated Lantern engine treats HTTP/3 as multiplexed, uses Chrome's renderBlocking protocol status, and aligns same-frame text LCP with FCP—which can shift lab scores (especially on JS-heavy sites) without altering real-user CrUX field data.
3. Does this Lantern update affect Google Search rankings?
No. Google's page experience evaluation uses real-user CrUX field data over a rolling 28-day window (LCP <= 2.5 s, INP <= 200 ms, CLS <= 0.1), not simulated Lighthouse lab scores.
4. How does Chrome 158's Memory panel reduce false-positive leak reports?
It recognizes suspended async functions and generators as live closures instead of dead context fields, ignores top-level functions of finished ES modules, attributes uncompiled function ScopeInfos to their parent scripts, and scopes live heap timeline statistics to the active recording view.
5. Can AI coding agents analyze heap snapshots without a live browser?
Yes. The December 2026 chrome-devtools-mcp updates support offline .heapsnapshot analysis, analyze_heapsnapshot_contexts for V8 execution context retention, and paginated compare_heapsnapshots diffs sorted by self-size.
Sources
- Chrome for Developers — New in DevTools - December 2026 (Published November 13, 2026)
- Chrome for Developers — How WeTV cut performance debugging time by 87% using Chrome DevTools for agents (Published November 10, 2026)
- Chrome Releases — Chrome for Android Update (Chrome 158.0.8127.36) (Published November 12, 2026)
- Chrome for Developers — Chrome 158 beta (Published October 28, 2026)
- Minerva Web Development — Lighthouse 13.6: Why Your PageSpeed Insights Score Changed (Published November 8, 2026)
- Nemo Ciment — Lighthouse 13.6 changes PageSpeed Insights scores (Published November 3, 2026)